Serviced Accommodation: Nightly Rates, Occupancy and the Break-Even Question
 data-pin-media="https://dfordeals.co.uk/blog/images/guides-serviced-accommodation-break-even-guide.png" data-pin-description="Serviced Accommodation: Nightly Rates, Occupancy and the Break-Even Question" data-pin-url="https://dfordeals.co.uk/blog/guides-serviced-accommodation-break-even-guide.html"
Serviced accommodation looks attractive on paper, the nightly rate is several times a monthly rent divided by 30. But the model is occupancy-driven, and the difference between a good short-let deal and a trap is one number: break-even occupancy. This guide explains how to compute it from market data.
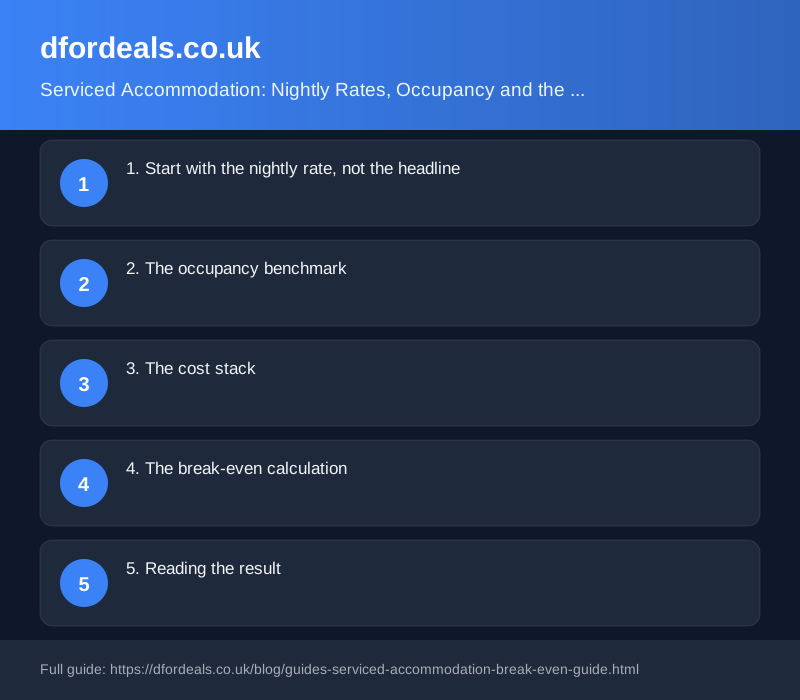
1. Start with the nightly rate, not the headline
Real listing data across the UK shows a wide spread in average nightly rates. Popular holiday-let towns (Whitby, York, Scarborough, Bridlington, Keswick) show averages from around £150 up to £300 a night for mid-size properties, while urban areas with limited tourism demand often sit between £70 and £120. The average is a starting point, the specific property's rate depends on size, quality, seasonality and listing performance.
2. The occupancy benchmark
The UK short-let market is commonly benchmarked at around 40% average occupancy. Holiday areas run higher in season (60%–80%) and much lower out of season; city short lets are steadier but rarely exceed 50%–60% at the property level. Using 40% as the working figure keeps the appraisal honest.
3. The cost stack
Revenue is not income. A realistic operating cost stack for serviced accommodation, expressed as a share of revenue, is roughly: platform fees 15%, cleaning and turnover 10%, maintenance and repairs 5%, utilities and insurance around £150–£175 a month fixed. On top sit the financing costs: mortgage interest on the loan (working assumption 5.5% on a 75% LTV), or bridge finance during setup at 0.6%–0.9% a month.
4. The break-even calculation
Break-even occupancy is: fixed monthly costs (mortgage + utilities + insurance) divided by monthly revenue at 100% occupancy net of the variable percentage. Worked example: a £200,000 property at 75% LTV costs £688 a month in mortgage interest at 5.5%, plus £175 fixed running costs, £863 total. At a £120 nightly rate, 100% monthly revenue is £3,600, and net of 32% variable costs it is £2,448. Break-even occupancy is 863 ÷ 2,448, about 35%. At a £70 nightly rate the same property needs over 60% occupancy, a much thinner proposition.
Real data shows the spread: high-rate coastal towns can show break-even occupancy below 15%, while lower-rate urban areas can exceed 80%, meaning the model only works at near-full occupancy.
5. Reading the result
A break-even occupancy comfortably below the market benchmark (40%) means the model has headroom; one close to or above the benchmark means demand softness destroys the numbers quickly. Pair the calculation with the local position on planning and licensing, permitted development rules for short lets changed across the UK in recent years, and some areas require planning permission or licensing for frequent letting, and with a professional review of the local market before committing.
The single number to take away: work out the break-even occupancy for every serviced-accommodation opportunity before comparing anything else. If the data doesn't support it, the headline rate is irrelevant.